Past performance does not predict future returns. You may get back less than you originally invested. Reference to specific securities is not intended as a recommendation to purchase or sell any investment.
Share Price Performance
Discrete Share Price Performance (%)
| 12 months to end of | Mar 24 | Mar 23 | Mar 22 | Mar 21 | Mar 20 |
|---|---|---|---|---|---|
| Edinburgh Investment Tst plc | 8.9 | 8.4 | 10.6 | 46.4 | -29.4 |
| Net Asset Value | 13.4 | 7.9 | 14.0 | 34.8 | -26.7 |
| FTSE All Share | 8.4 | 2.9 | 13.0 | 26.7 | -18.5 |
Cumulative Share Price Performance (%)
| As at previous day end | 1 month | 3 months | 6 months | YTD | 1 year | 3 years | 5 years | 10 years |
|---|---|---|---|---|---|---|---|---|
| Edinburgh Investment Tst plc | 7.0 | 13.2 | 14.8 | 9.0 | 14.1 | 30.6 | 50.3 | 85.5 |
| Net Asset Value | 1.6 | 7.2 | 12.6 | 6.6 | 11.9 | 33.3 | 39.1 | 86.9 |
| FTSE All Share | 5.8 | 11.8 | 14.8 | 9.4 | 12.0 | 25.0 | 37.6 | 80.1 |
Source: FE fundinfo as at 09/05/2024. Performance figures are shown in GBX and in total return terms, with net dividends reinvested.
Premium/Discount history
If a trust’s share price is higher than its net asset value (NAV) then it is said to be trading at a ‘premium’; if the share price is below the NAV then it is trading at a ‘discount’. A figure above 0 is a premium and one below 0 is a discount.
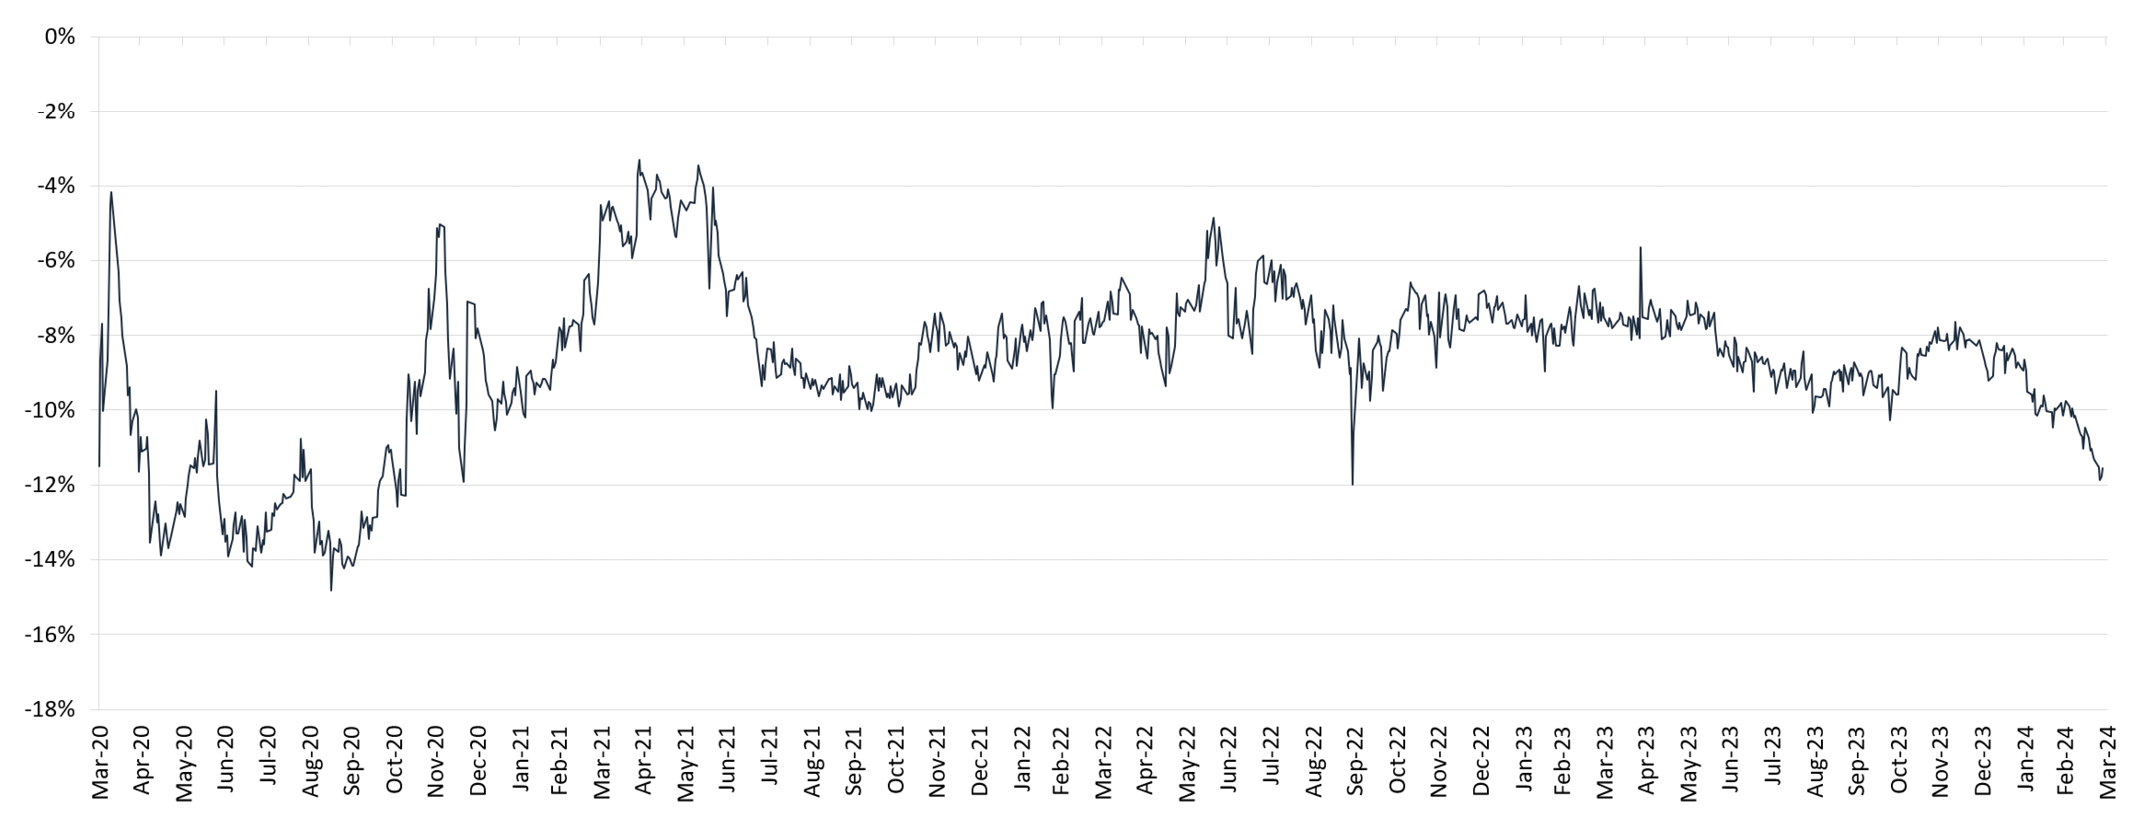
Source: Bloomberg as at 31/03/2024. Cumulative income net asset value (debt at fair value).
Current positioning
Top 10 Holdings (% of assets)
SHELL PLC
8.1
UNILEVER PLC
4.8
TESCO
3.9
ASTRAZENECA PLC
3.8
HALEON PLC
3.7
GSK PLC
3.7
NATWEST GROUP PLC
3.6
COMPASS GROUP PLC
3.5
DUNELM GROUP PLC
3.4
BAE SYSTEMS
3.1